Leveraging Technology for Data Analysis and Reporting in Business
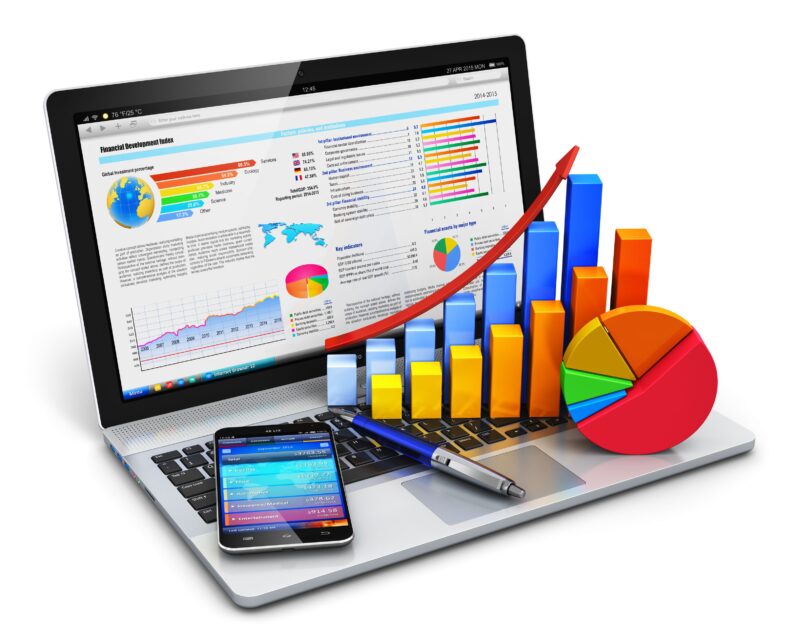
In today’s data-driven world, businesses that can effectively analyse and report on their data have a significant competitive advantage. Technology plays a crucial role in streamlining these processes, transforming raw information into actionable insights that drive strategic decision-making. This blog explores how technology enhances data analysis and reporting, outlines some of the most effective tools for the job, and provides links to access these platforms.
The Importance of Data Analysis and Reporting in Business
Before diving into specific tools, it’s essential to understand why data analysis and reporting are critical for business success:
- Informed Decision-Making: Data analysis helps businesses make evidence-based decisions, minimising risks and maximising opportunities.
- Performance Tracking: Effective reporting allows organisations to monitor key performance indicators (KPIs) and measure the success of various initiatives.
- Identifying Trends: Data analytics can reveal patterns and trends, helping businesses forecast future outcomes and adjust strategies accordingly.
- Operational Efficiency: Technology automates data collection and analysis, saving time and resources while reducing the risk of human error.
How Technology Enhances Data Analysis and Reporting
Technology has revolutionised data analysis and reporting by providing advanced software tools that automate processes, visualise complex data, and uncover insights that might be missed with traditional methods. Here’s how technology makes a difference:
- Automation: Modern data analytics tools automate data collection, cleansing, and processing, allowing analysts to focus on extracting insights rather than managing data.
- Data Visualisation: Advanced software solutions turn data into visually engaging charts and dashboards, making it easier to understand trends and patterns.
- Real-Time Analysis: With the rise of big data, businesses can access and analyse data in real-time, enabling faster response times and more agile strategies.
- Predictive Analytics: Artificial Intelligence (AI) and Machine Learning (ML) algorithms can analyse historical data to predict future trends and outcomes.
Top Tools for Data Analysis and Reporting
Here are some of the most popular apps and software for data analysis and reporting, each with unique features designed to help businesses extract value from their data.
1. Microsoft Power BI
Microsoft PowerBI is a powerful business analytics tool that allows users to create interactive dashboards and reports. It connects to a wide range of data sources, making it easy to compile and analyse data from multiple platforms.
- Key Features: Interactive dashboards, real-time data updates, AI-driven insights, and integration with other Microsoft products.
- Use Case: Ideal for businesses that want to make data-driven decisions quickly and efficiently.
- Download: Power BI for Desktop | Power BI Mobile for Android | Power BI Mobile for iOS
2. Tableau
Tableau is a leading data visualisation tool that helps businesses turn complex data sets into intuitive graphs and charts. It offers drag-and-drop features and is known for its ability to connect to a wide variety of data sources.
- Key Features: Interactive visualisations, real-time data analysis, and the ability to share dashboards securely.
- Use Case: Perfect for companies that prioritise data storytelling and require robust visualisation capabilities.
- Download: Tableau Desktop | Tableau Mobile for Android | Tableau Mobile for iOS
3. Google Data Studio
Google Data Studio is a free tool that allows businesses to create customisable, interactive reports using data from Google Analytics, Google Ads, and other Google platforms. It’s a valuable tool for marketers and analysts who need to report on digital performance.
- Key Features: Customisable dashboards, integration with Google services, and real-time data updates.
- Use Case: Best for businesses that rely heavily on Google’s ecosystem and want an affordable reporting solution.
- Access: Google Data Studio Web
4. IBM Cognos Analytics
IBM Cognos Analytics is an AI-powered business intelligence (BI) platform that provides comprehensive data analysis and reporting features. It uses AI to suggest insights and automate data preparation, making it accessible to non-technical users.
- Key Features: AI-driven insights, automated data preparation, and customisable reporting.
- Use Case: Suitable for large enterprises that need a scalable and secure BI solution.
- Download: IBM Cognos Analytics Web
5. Looker
Looker, now part of Google Cloud, is a modern data platform that helps businesses analyse and explore data. It integrates seamlessly with Google Cloud services and supports data-driven decision-making across teams.
- Key Features: Custom data models, integration with Google Cloud, and embedded analytics capabilities.
- Use Case: Great for organisations looking to build custom analytics workflows and leverage cloud-based solutions.
- Access: Looker Web
6. SAP Analytics Cloud
SAP Analytics Cloud is an all-in-one cloud-based solution for business intelligence, planning, and predictive analytics. It integrates with SAP’s ecosystem, making it a powerful tool for businesses already using SAP solutions.
- Key Features: Predictive analytics, planning and forecasting, and integration with SAP applications.
- Use Case: Best suited for large corporations that rely on SAP for their business operations.
- Download: SAP Analytics Cloud Web
Additional Tools for Enhanced Data Management
7. Excel and Google Sheets
While advanced tools are essential, Excel and Google Sheets remain staples for data analysis, particularly for smaller data sets and basic reporting needs. They offer features like pivot tables, charts, and formulas for data manipulation.
- Use Case: Suitable for small to medium-sized businesses that require straightforward data analysis and reporting tools.
- Download: Excel for Android | Excel for iOS | Google Sheets Web
The Future of Data Analysis and Reporting
The landscape of data analysis and reporting continues to evolve with advancements in AI and ML. Future trends include:
- Predictive and Prescriptive Analytics: As businesses collect more data, there’s a growing emphasis on not only understanding past trends but also predicting future outcomes and prescribing actions.
- Natural Language Processing (NLP): NLP technology allows users to interact with data analysis tools using natural language, making insights more accessible to non-technical staff.
- Data Governance: As data privacy regulations become stricter, robust data governance and security measures are becoming integral to analytics platforms.
Conclusion
Technology has fundamentally transformed how businesses approach data analysis and reporting. Tools like Microsoft Power BI, Tableau, and Google Data Studio empower organisations to make data-driven decisions with confidence. Whether you’re a small business owner or a data scientist at a large corporation, leveraging the right technology can streamline your operations and give you a strategic edge.
Do you have a favourite data analysis tool that you use in your business? Share your experiences or thoughts in the comments section below!


